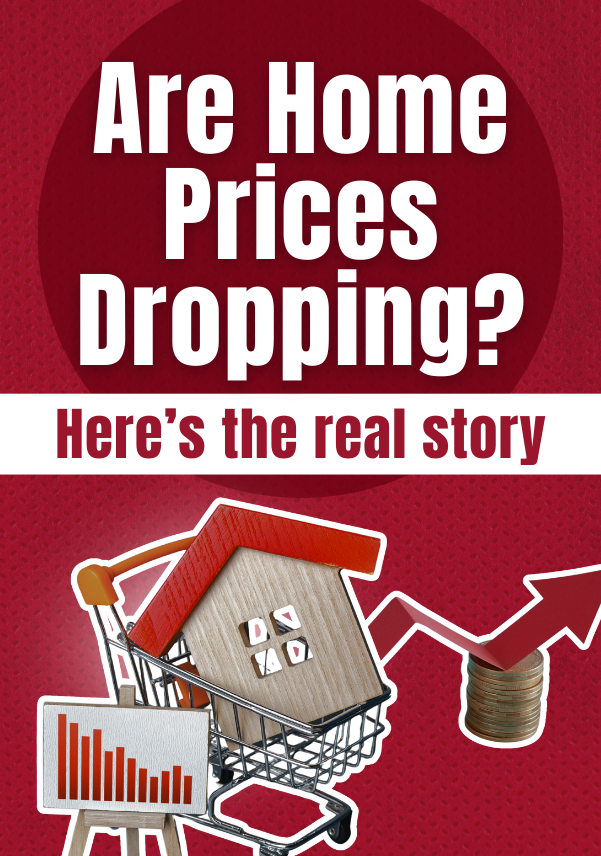
You’ve probably seen social posts shouting that “home prices are falling.” That kind of headline makes anyone with a house (or thinking about one) stop and worry: Is this the start of a crash? Is my equity disappearing?
The short answer: no — this is not a nationwide crash, and most homeowners aren’t suddenly underwater. Below I expand the data, explain what’s really going on in different regions, and give concrete signs to watch in your local market.

At the national level prices are largely holding steady or inching up rather than collapsing. Recent reports from National Association of Realtors show median prices rising year-over-year — not the breakneck growth of the boom years, but steady appreciation nonetheless. Why that matters: modest price growth is normal in a maturing market and reflects a balance forming between buyer demand and available supply.
What this looks like in practice: in many metros you’ll see price increases measured in low single digits, sales activity that ebbs and flows seasonally, and fewer headline-grabbing double-digit gains. For homeowners this means your equity is generally stable; for buyers it means less frantic competition and a bit more predictability when budgeting. The national snapshot gives useful context, but remember it’s an average — the on-the-ground story depends on your neighborhood.
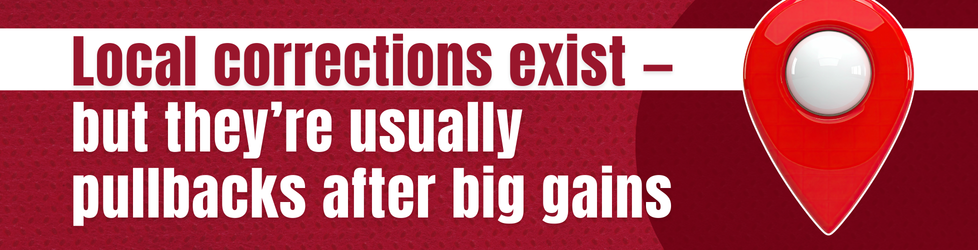
Yes, some markets have experienced mild declines — particularly select metros in the West — but those areas tend to be places that ran hot earlier in the cycle. When you zoom out to a multi-year view (5+ years), research from groups such as ResiClub and Zillow shows that values in many of those same markets remain substantially higher than they were a few years ago. In other words, recent small dips often represent a short-term recalibration after atypically large appreciation — not a reversal of long-term gains.
Practical implication: a temporary price dip doesn’t erase years of growth for most homeowners. If you own in an area that’s down slightly, compare current values to a five-year (or longer) baseline — that will give you a far clearer sense of your net position than a single month’s headline.

If you want to judge whether a slowdown is temporary or meaningful where you live, track these local indicators rather than national clickbait:
Pending sales / new contracts: rising pendings point to future closings; falling pendings can signal real cooling.
Active inventory and new listings: more listings generally give buyers more choices and ease upward price pressure.
Days on market and sale-to-list price ratio: longer DOM and lower sale/list ratios indicate weakening demand; stable or shrinking DOM and sale prices near list suggest steady demand.
Local employment and new construction: strong local jobs growth supports housing demand; lots of new supply can cap price gains.
Price vs. long-term trend: compare current prices to 3–5 year averages to see whether a “drop” is a correction or a deeper move.
Actionable guidance:
If you’re selling: get a local comparative market analysis (CMA) from an agent and price to attract interest — avoid overpricing based on old comps.
If you’re buying: use temporary softness to negotiate (contingent on solid inspections/pending indicators) but check long-term trends before assuming permanent declines.
If you’re holding: focus on longer horizons — most homeowner wealth builds over years, not months.
Bottom line
Don’t let a viral headline about falling prices define your view of the market. Nationally, prices are generally holding up or rising modestly; localized declines tend to be corrections after strong earlier gains. The best way to know what’s happening for your house is to look at local data — pending sales, inventory, days on market and multi-year price trends — and interpret them with a local agent’s context.
🏠 If you want, we can pull the recent neighborhood metrics for your ZIP code so you get the precise picture that actually matters. Contact us.